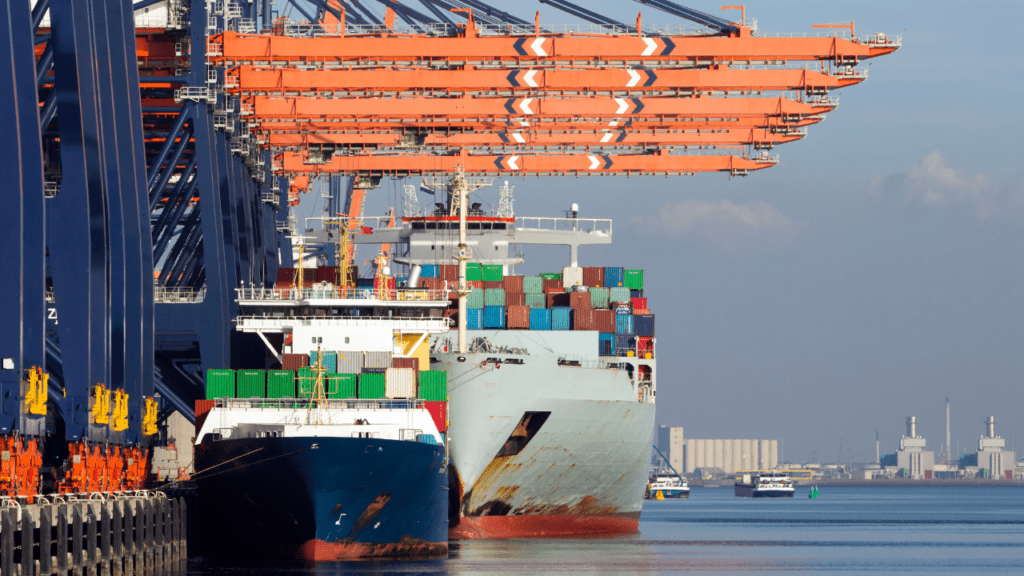
The freight industry is looking at a ‘very, very ugly’ end of 2022
Peak season, an annual event in the freight industry, serves as the most important season in the calendar for many transportation firms. Depending on mode, peak season kicks off at different points on the calendar, mostly based around the role in the supply chain that a freight provider plays in ensuring that retail goods are on the shelves for the holidays.
Peak season by mode:
- Ocean container: July through September
- Trucking and rail intermodal: October through December 15th
- Parcel: Black Friday through December 24th
With the peak season already completed in ocean freight, we can say with certainty that this year’s peak season will be incredibly weak.

Back in June, FreightWaves reported that ocean container volumes were dropping quickly, based on data found in SONAR’s Container Atlas, which tracks bookings volumes at the point of origin. By tracking point of origin bookings, we get an advanced look at import volumes months before those containers hit U.S. ports. At the time of publication, we believed that the contraction in volumes would happen at U.S. ports by July, but we underestimated how long it would take to clear the backlog of containerships off major U.S. ports and then waiting to clear U.S. Customs.
In August, it appeared that FreightWaves’ warning was unwarranted, at least looking only at U.S. customs import volume data. That data showed the market was relatively stable and hadn’t contracted.
But maritime spot rates and container shipping lines’ actions told a completely different story.
Ocean spot rates and imports fell off a cliff this year
First, we saw container rates collapse – suggesting that carriers were rapidly losing pricing power. When we published our June piece, the cost to ship a 40-foot container from China to the U.S. West Coast was $9,630. Today the same container would be transported for $2,470 – 74% lower than just a few months ago. This happened in a backdrop of a significant number of “blank sailings” by container ship lines. The container lines will cancel voyages to pull capacity out of the market.
According to Sea-Intelligence, container lines have canceled more than quarter of sailings across the Pacific in recent weeks.
Freight transportation is a commodity and responds to the laws of supply and demand. The collapse in container rates reflected volumes that were quickly deteriorating.
By September, the slowdown in container import volumes was becoming too significant to dismiss, even for the most hardened skeptic. The Port of Los Angeles reported that it handled the fewest number of loaded import containers for the month of September since the Great Financial Crisis (2009). The Port of Los Angeles is the largest port in the United States.
Weak import volumes weren’t just limited to Los Angeles, but affected all the major West Coast ports. Long Beach posted the lowest September loaded imports since 2016; Seattle/ Tacoma had its worst September for loaded imports in seven years. The decline in volumes will take longer to hit East Coast ports, but it’s already starting – September was Savannah’s weakest month this year for loaded imports, down 9.8% year-over-year.
With an estimated 75% of U.S. container imports related to consumer activity, a sharp drop in volume provides an ominous warning for any mode of transportation that is further downstream and closer to the point of consumption.
How the trucking turndown materialized
The trucking industry has been struggling since the first quarter. FreightWaves predicted that a freight recession was imminent, based on the drop in truckload volumes and tender rejections in the first quarter.
The SONAR Outbound Tender Volume Index (OTVI) measures truckload load requests from shippers to carriers, moving under contract rates. From the start of February to the end of March, it dropped by 12%.
The volume drop continued in April and May, with OTVI registering another 2.5% decline, but stabilized in June in conjunction with the summer construction, beverage, and produce shipping seasons. In June, the OTVI index registered an increase of 1%.

A stable June provided some confidence to carrier executives that the slowdown in the earlier part of the year was just a cooling of volumes from the inflated levels of the COVID economy.
Unfortunately, the optimism at the end of June was short-lived and proved to be an anomaly in a disappointing year.


